Widget Insights
Widget Insights provide detailed, interactive views of your financial data. Click on any dashboard widget Insights button to access its corresponding insight view. Each Widget Insight offers:
- Interactive Charts - Visualize your data with expandable, detailed charts
- Period Navigation - Navigate through weeks, or months while maintaining context
- Drill-Down Details - Expand categories and groups to see underlying transactions
- Comparative Analysis - View trends, variances, and percentages
Available Widget Insights
Biggest Expense Insights - Analyze your highest expenses with top 5 breakdown, chart visualization, and detailed transaction information including notes and images.
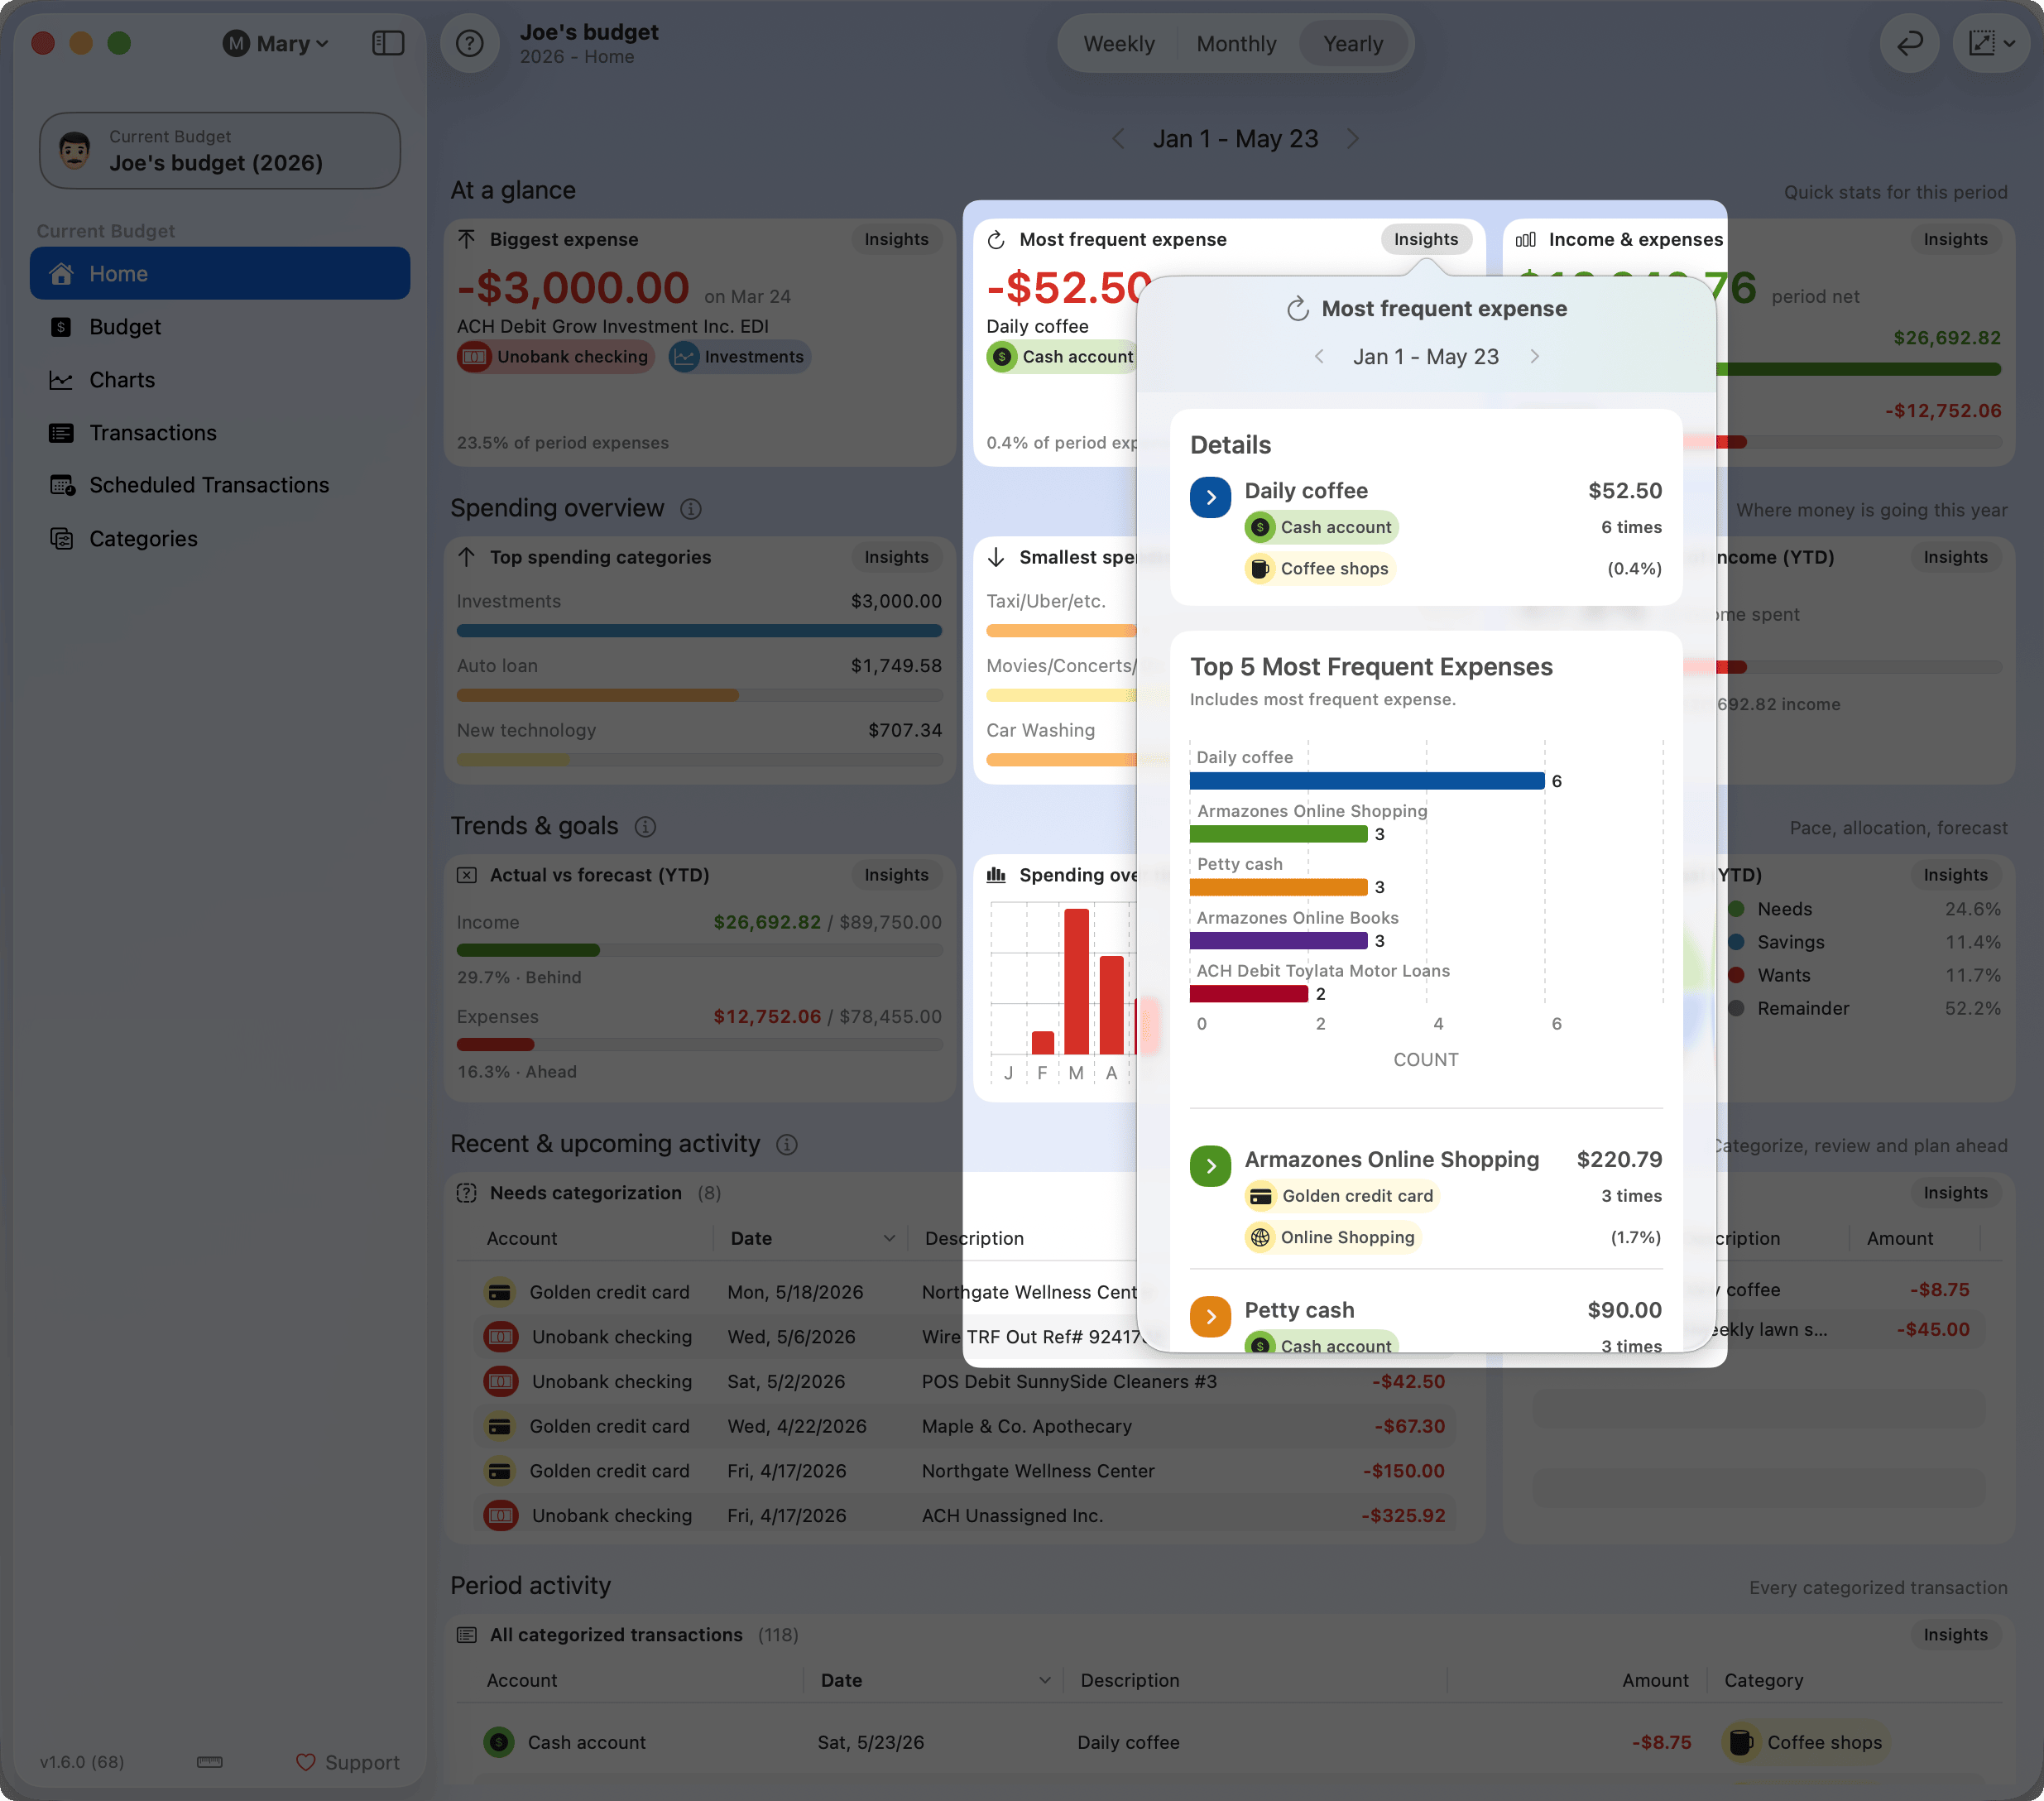
Most Frequent Expense Insights - Track recurring expenses by frequency, see which expenses repeat most often, and understand spending patterns grouped by description, account, and category.
Income & Expenses Insights - Detailed breakdown of income and expenses with filtering by root categories, top 5 categories per selection, and percentage distributions.
Top Spending Categories Insights - View your highest spending categories (5 for weekly, 10 for monthly/yearly) with detailed breakdowns, top highlights, and comprehensive transaction lists.
Smallest Spending Categories Insights - Identify your lowest spending categories to find opportunities for optimization or categories that need attention.
Spending as % of Income Insights (YTD) - Comprehensive year-to-date analysis showing income vs expense breakdown, top 10 categories for each, monthly cumulative progression, and ratio calculations.
Actual vs Forecast Insights (YTD) - Compare your actual performance against forecasts with variance analysis by category, pace calculations, status indicators (ahead/on track/behind), and monthly progression charts.
Spending Over Time Insights - Stacked timeline visualization showing expense distribution across time (daily for week/month, monthly for year) with top categories highlighted and remainder tracking.
Spending by Goal Insights (YTD) - Analyze budget goal performance with target vs actual comparisons, top categories per goal, and tracking of unassigned or uncategorized expenses.
Needs Categorization Insights - Monitor categorization progress with separate tracking for income and expenses, showing counts, amounts, and percentages for both categorized and uncategorized transactions.
Coming Up Insights - Preview upcoming scheduled transactions with monthly projections, grouping by repeat type, total impact calculations, and expected income vs expense analysis.
All Categorized Transactions Insights - Explore all categorized transactions with three view modes: summary (category totals), detailed (expandable category groups), and list (flat transaction list).
Note: Widget Insights automatically adapt to your selected time period (week/month/year) and respect your budget year boundaries for navigation.